Designing Org charts
What is an organizational chart
More information on organizational chart diagram type can be found in the following article: https://grapholite.com/Diagrams/OrganizationCharts
Drawing an organizations chart
Typically the title of the position (the job title) and the name of the person who occupies that position are shown in each box in the chart. The best practice is to show the title above the name, because it's the positions that define the organization, not the people who currently occupy them. You can change people within positions without changing the special arrangement of the chart.
You can add other fields to a box too. Adding a phone number is one common addition.
Grapholite offers the ability to easily create org charts with a set of stencils and predefined shape layouts and behavior. All you need is to create the Org chart document and the app will offer you a corresponding shapes library and layout types:
1. Click the menu icon and select the New drawing item .
2. Select Org chart and the corresponding document type will be created. It will immediately open the necessary shape set.
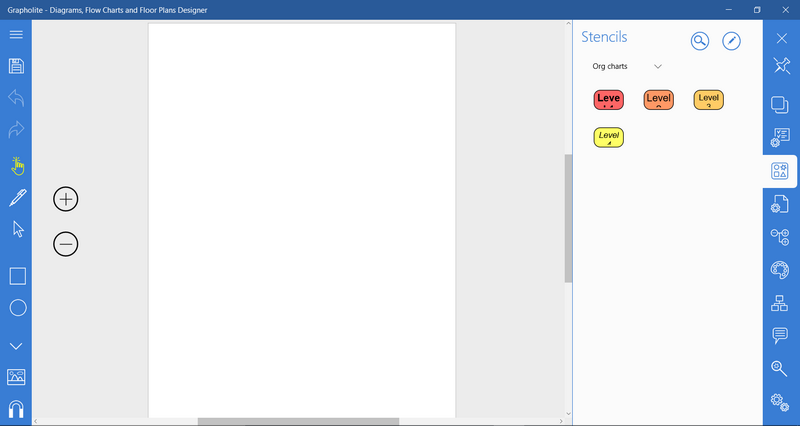
You see that all the elements are of different levels, which will help you create a structured hierarchical diagram.
1. Add Level 1 shape to the diagram by clicking a stencil on the table.
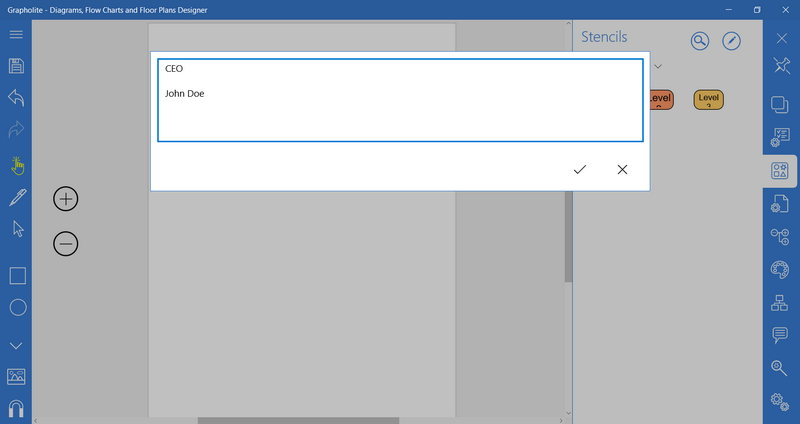
2. Add position and name. Click the shape once again and enter the necessary information to in the appeared textbox. Click the checkmark to save changes.
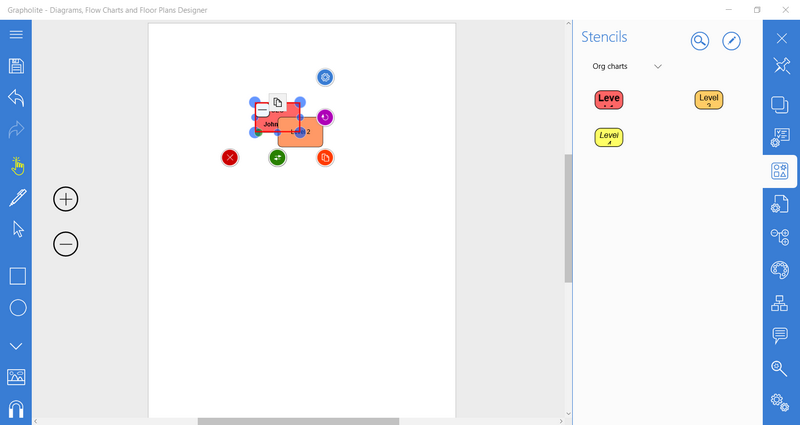
3. Add peers and direct reports. Direct reports should be of a different level. So, click Level2 stencil to add the next hierarchy level.

4. Now you can add connections. You can do it manually like this: select the CEO shape and drag and drop the connector icon to the Level2 shapes until the connection point becomes red and pulsating. It indicates the correctly established connection. Or you can just drag-and-drop the lower level node to the parent node (drop it over the parent element) and the connection will be automatically established. And the easiest way to setup a connection is to drag-and-drop an org chart object to the parent node directly from the toolbox.
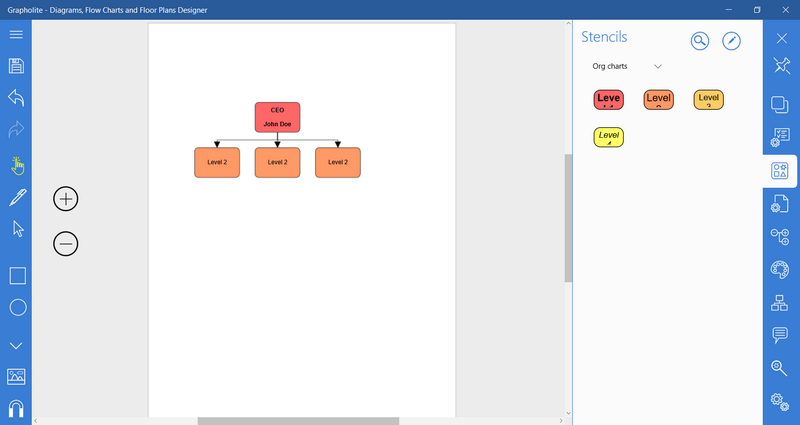
5. In the same way, add more levels to the diagram and set connections between them.

Rearranging the chart
If you want to make changes to any of the positions within the chart, it's as easy as dragging the box to where you want it to go: up a level, down a level or side to side. Simply select the box you want to move and drag it around on the page. As you move it, you can see that Grapholite automatically re-layouts the other shapes and connections. If you drag the shape over the other shape, you will see that the object under the one you are dragging is marked with a red pulsating rectangle. Drop the shape there and it will become the subordinate org chart element of that red pulsating object and will automatically position to have equal connections and even spaces. Grapholite will keep your chart neat and orderly. In this way, you can easily rearrange your chart without extra effort.
When you add a new position or remove the existing one, Grapholite reformats the diagram to accommodate the changes.
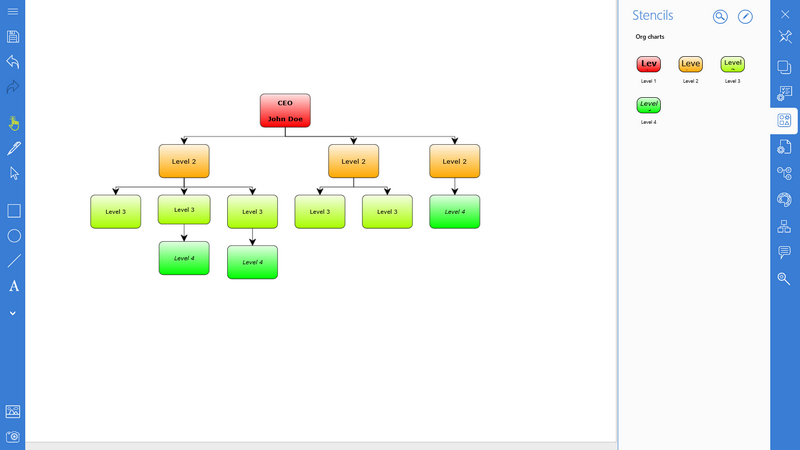
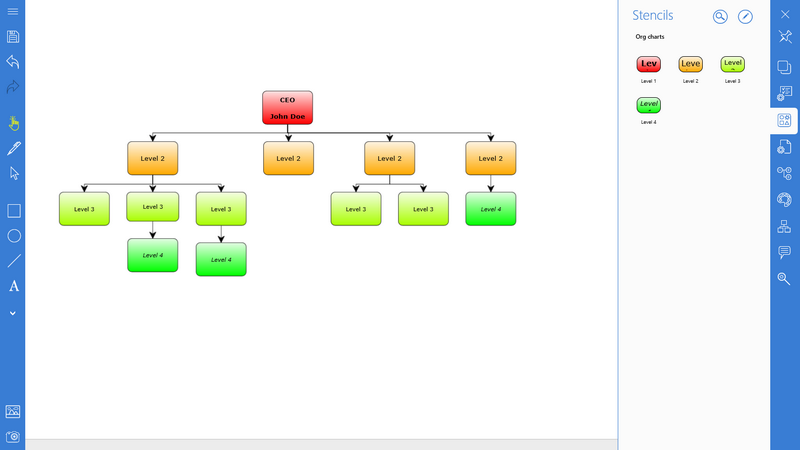
Inserting a position: Add a new position by clicking the corresponding stencil. Add connection from the supervising position and the chart will automatically re-layout.
Before adding a position |
After adding a position |
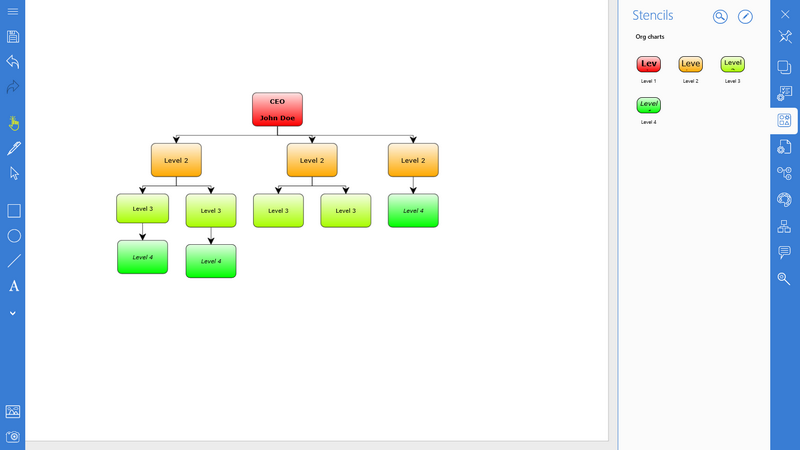
Deleting a position: To delete a position, just select it and click the red cross icon that will appear among the short key commands. The chart will automatically re-layout as shown below.
Before deleting a position |
After deleting a position |
Layout and orientation
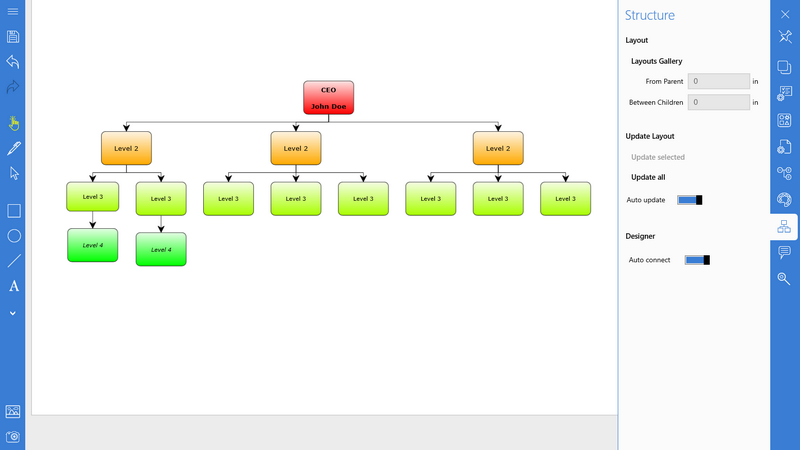
Grapholite offers the ability to change type of layout and orientation of the entire diagram or its separate nodes to use screen space more efficiently and make the chart more readable and professional.
The most common arrangement for the boxes in an organization chart design is a horizontal layout of the first level below the top position, and a vertical layout below this.
The default layout is horizontal and your diagram will look like this.
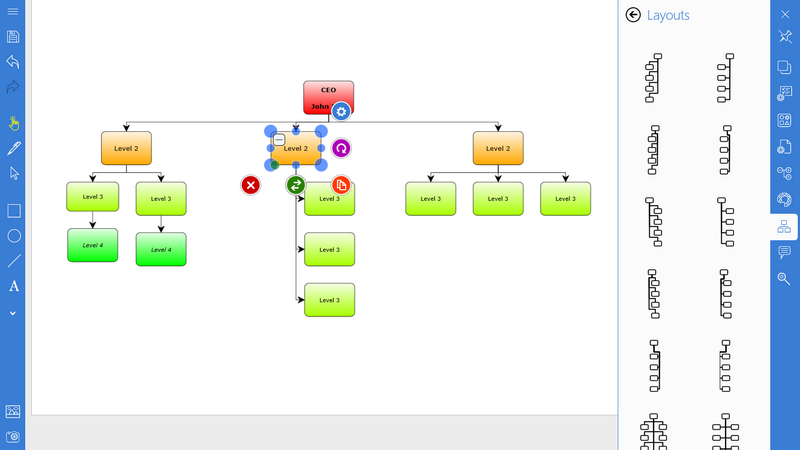
We can optimize it by changing layout type of the selected nodes and their subordinates.
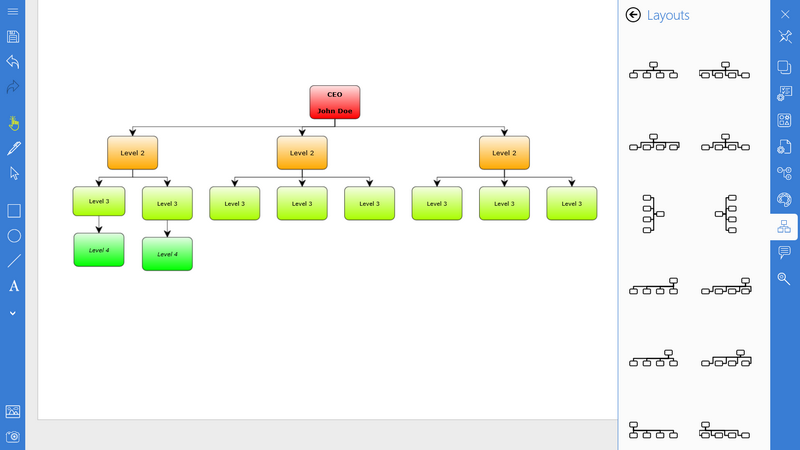
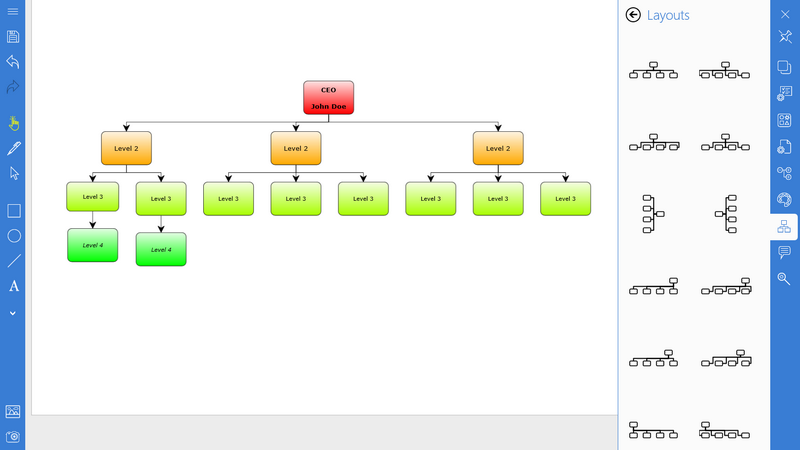
1. Select the Level 2 node and proceed to the Layout panel.
2. Click Layouts Gallery to see the list of available layouts.

3. In the list, select the necessary layout type and click it to apply to the selected node.

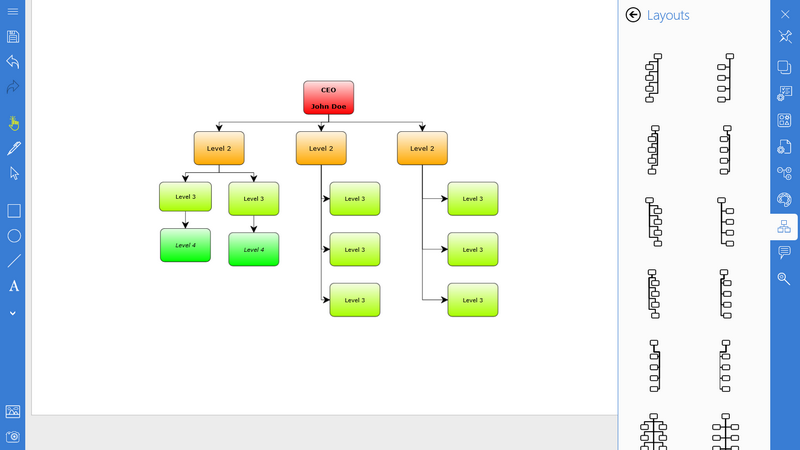
4. Let’s rearrange the other Level 2 node in the same way.

As you see, now the chart occupies less screen space and it became more readable.