Flow charts

What is a flowchart
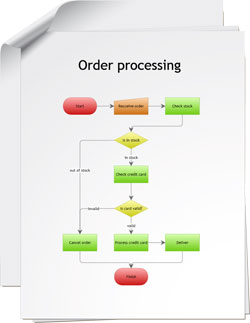
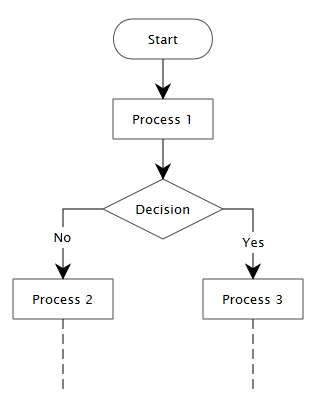
A flowchart is a graphical description of a process or algorithm using various symbols of different forms to represent operations, data, threads, etc. relations between which are shown by the arrows. Flowcharts are used to explain sophisticated ideas in simplified manner so that even inexperienced audience could easily get the idea. Flowcharts are also helpful to their creators — when developing a flowchart you visually break a process to steps and begin to clearly understand the step's place as a part of the process as a whole.
Why use flowcharts
Flowcharts will help you understand how logical the process is, discover problem areas and relations breaks, define the complexity of a process, and create a common knowledge base for a process.
Flowcharts are commonly used to:
- document and describe the existing process;
- develop modification to the existing process or research where the problems may arise;
- develop an absolutely new process;
- define how, where and when to measure the existing process in order to make sure it corresponds to the requirements.
How Grapholite can help
Grapholite allows you to easier create a flowchart by offering the following abilities:
- smart drawing tools, automatic connectors and shape library to create flow charts of processes, algorithms and procedures;
- ability to work in online and offline modes; in and out of browser
- export to the most commonly used picture and document formats

Flowchart Symbols
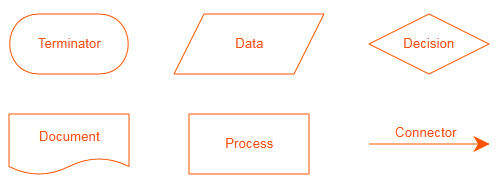
Different flow chart symbols have different meanings. The most common flow chart symbols are:
- Terminator: Represented by an oval denoting the start or end of the process.
- Generic processing step: Represented as rectangle indicating a normal process flow step.
- Decision: Represented as diamond indicating a branch in the process flow.
- Connector: Represented by an identifying label inside a circle used to indicate a jump in the process flow.
- Data: A parallelogram that shows instructions or actions.
- Offpage Connector Symbols: are used to indicate that the flowchart continues on another page.
- Document: used to represent any type of hard copy input or output (i.e. report).

How to Draw a Basic Flowchart
Easy creation of flowcharts is a primary function of Grapholite. To illustrate it, we've made the following video. A slower video version, paying attention to every detail, is available by the link.