UML diagrams
What is UML (Unified Modeling Language)?
UML or Unified Modeling Language is a language of graphical description for object-oriented modeling in software development. UML was created to define, visualize, construct and document mainly software systems. Though, the use of UML is not limited to software development. It is also used to model business processes, design systems and visualize organizational structures.
UML Advantages
- UML is object-oriented. As a result analysis results methods and construction methods are semantically close to programming methods using current object-oriented languages;
- UML makes is possible to describe the system from virtually all possible points of view and give various aspects of system behavior;
- UML diagrams are quite easy to understand;
- UML extends and allows addition of custom text and graphical types which makes it possible to use not only in software engineering;
- UML is a unified standard and it is dynamically evolving.
How Grapholite can help
Grapholite allows you to easier create a UML diagram by offering the following abilities:
- complete set of UML elements right under your fingertips, just look at the toolbox;
- smart drawing tools, automatic connectors and shape library to create flow charts of processes, algorithms and procedures;
- export to the most commonly used picture and document formats.
Types of UML Diagrams
There are 14 types of UML diagrams. They can be divided into two categories: Structure diagrams (representing information structure) and Behavior diagrams (representing behavior of the system and different aspects of interactions).
Structure Diagrams
- Class Diagram is a static diagram describing system structure. It demonstrates system classes, their attributes, methods and relations between the classes.
- Component Diagram is a static structure diagram that shows division of a software system into structural components and relations between the components. The components can denote files, libraries, modules, executable files, packages, etc.
- Object Diagram shows complete or partial snapshot of the modeling system in some specific moment. It displays system class instances (objects) and states current values of their values and relations between the objects.
- Composite Structure Diagram is a static structure diagram demonstrating inner structure of classes and, if possible, interaction of the elements of the inner class structure. Composite structure diagrams can be used together with Class Diagrams.
- Package Diagram is a structure diagram showing packages and relation between them. This diagram type is used to organize elements into groups based on some condition in order to simplify structure and work with the system model.
- Deployment Diagram is used to model operating nodes and artifacts deployed on them.
- Profile Diagram describes extension mechanism to the UML. They contain stereotypes, tagged values, constraints that are applied to classes, attributes, operations and activities. Profiles make it possible to adjust UML to different platforms and domains.
Behavior Diagrams
- Activity Diagram is a diagram showing how some activity is divided into constituent parts. Activity diagrams are used to model business processes, technological processes and parallel calculations.
- Use Case Diagram describes relations between actors and use cases. The main purpose is to provide a unified tool to the customer, end user and developer that will allow collective discussion of the system features and behavior.
- State Machine Diagram depicts dynamic behavior of an entity based on its response to events, showing how the entity reacts to various events depending on the current state that it is in.
- Communication Diagram shows interaction between the parts of the composite structure and cooperation roles. It clearly states relations between the elements (objects).
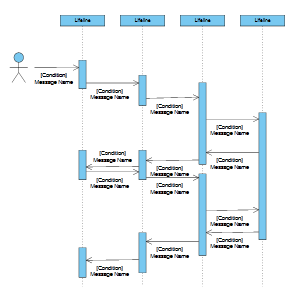
- Sequence Diagram is used to visualize sequenced interaction of the objects. It shows objects participating in interaction and sequence of the messages they exchange.
- Interaction Overview Diagram includes a part of a Sequence diagram and constructions of the management stream. It helps to review objects interaction from different points of view.
- Timing Diagram is a specific type of interaction diagram focusing on timing. This diagram type is used to explore behavior of objects throughout a given period of time.
How to Draw a UML diagram
Grapholite is designed to create UML Diagrams professionally and conveniently. Simply choose New from the File menu, then just drag-and-drop the necessary shapes and show connections by the arrows. Or use one of the pre-designed templates.