Venn diagrams
What is a Venn chart
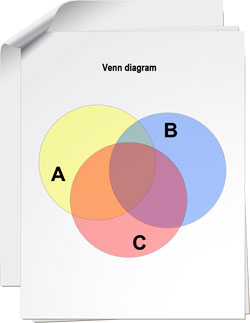
Venn chart is a diagram with overlapping circles that show relations between the sets to make them visually represented. They are used in mathematics, logic, management and other applied areas. Venn charts can help you see how much different things have in common. For example, in a two-set diagram, one circle may represent a group of all lighting units, while another circle may represent the set of energy-saving technologies. The intersection (overlapping area) will represent a set of all energy-saving lightning units. Venn diagrams do not contain information on the sizes of sets; they are schematic diagrams.
Why use Venn charts
Venn diagrams will help you compare raw data that is hard to understand or hard to see relations therein. With Venn diagrams, you will visually display the data to make it easier to analyze and comprehend, especially in presentations.
How Grapholite can help
Grapholite allows you to easier create a Venn charts by offering the following abilities:
- drawing tools and shape;
- ability to insert Venn chart into another diagram;
- export to the most commonly used picture and document formats.
Tips and tricks
- Consider the number of items you need to compare. Now you know the number of circles you need to draw.
- Draw the first circle to one side. The circle should be big enough to write characteristics of an object, place, person, or other item.
- Draw a circle of a similar size so that a portion of it overlaps your first circle. The intersection should be large enough to write characteristics that the items share.
- Label the circles with the names of the items you want to compare.
See also another article about Set Diagrams and types of Venn charts.