Venn and Sets Diagrams
Venn Diagrams is a common name of the variety of visualization methods and ways of graphical representation that are actively used in various ranges of science and mathematics: set theory, theory of probability, logic, statistics and information science. Venn diagram shows all possible relations between sets or events from some set. Common Venn diagram has three sets.
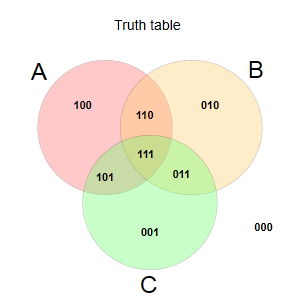
Venn diagram illustrating Truth table.
Venn diagram types
Euler diagrams
Euler diagrams are analogous to Venn diagrams but they don't obligatory illustrate all possible relations between the sets or events.
Johnston diagrams
Johnston diagrams are used to represent statements of propositional logic, such as “Not A or B is true” and visualize truth tables. They look like Venn diagrams but don't represent sets.
Karnaugh maps
Karnaugh map is a method to simplify Boolean algebra expressions. It represents operation of grouping and elimination of variables within groups. Karnaugh maps are considered as re-built truth table of the function.
Peirce diagrams
Peirce diagram is extension of Venn diagrams that includes additional information as well as information on probabilities and relations.
Edward's Venn diagrams
Edward’s Venn diagram represents higher number of sets using central symmetry and displaying sets as gears.
Basics of Venn diagrams
As mentioned above Venn diagrams are used to define all possible relations between the sets. They are created in the following way.
- Draw a rectangle to indicate an universal set;
- Draw 1 circle inside this rectangle to show some specific subset. For example, all wooden items.
- Draw the second circle inside the rectangle that will overlap the first one and indicate the other subset. For example, all chairs.
- The overlapping area or intersection represents the set of all wooden chairs.
As a result we have new subsets and can perform a number of set operations:
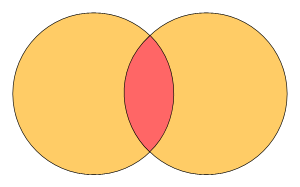
- Intersection
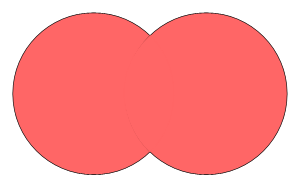
- Union
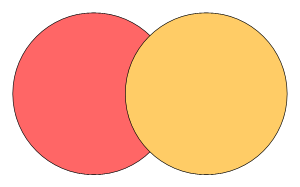
- Difference
Venn diagram set operations
Set operations are considered to get new sets based on existing ones.
Union of A and B sets is a set including all the elements that are in at least one of the sets A, B.
Intersection of A and B sets is a set including all and only those elements that in both sets A and B at the same time.
Difference of A and B sets is a set of all and only those elements B that are not A.
Symmetric difference of A and B sets is a set of elements which are in either of the sets and not in their intersection.
Tips and tricks
Venn diagrams are usually used to compare two items, their attributes and characteristics. So, you need to define what items you want to compare. Let's compare two cities, for example, Moscow and Washington D.C. Define what the cities have in common: they are both capitals of the countries, both cities have White Houses.
Define what the difference between the cities is: they are capitals of different countries (USA and Russia), different population (more 11 million and less than 1 million), and different designations of White Houses (America's President Residence and Russia's Vice President and Government Residence). Moscow is an ancient city founded in 11 century, Washington D.C. is quite a new city founded in 18 century. And you may add more and core criteria to compare the objects: climate, availability of museums, educational institutions, architecture, etc. The more criteria you define the more detailed and complete comparison will be.
Venn diagram cons
Don't use Venn diagrams to compare more than 3 objects. While Venn charts are successfully used to compare two or three sets and the diagram is easy to understand, everything changes when the number of sets increases. Shape intersections are very different and it's easy to miss configurations and get confused by a great amount of new sets. Such diagrams don’t provide much help. So, use Venn charts to compare 2 or 3 sets exclusively.
How to create a simple Venn Diagram
It's easy to draw a new Venn chart in Grapholite. It offers pre-designed Venn diagram samples that can be easily adapted to your analysis. You can also create diagrams from scratch: a library of corresponding shapes is included.