Chevron and Circular Diagrams
What is Chevron Diagram
Chevron diagram is a flow diagram representing steps or actions in a process with the help of cyclic or linear arrows (chevrons). They are used to emphasize direction of movement and interconnections of stages in a flow.
Why use Chevron Diagrams
Chevron diagrams depict process stages in a more understandable and vivid manner. Ordinary flow diagrams with blocks and thing arrows connecting them were used too often and they miss the main idea of any diagram — represent data that is easy to comprehend and analyze.
Common flow diagram
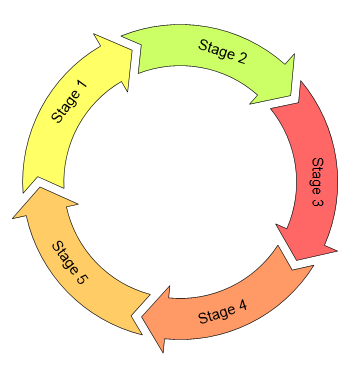
And now compare the same very data illustrated with Chevron diagram.
Chevron diagram
No comments. You see what stage should come next as arrows clearly define direction of the flow and each stage uses a different color — it's possible to emphasize the most important actions, for example, with red color.
Chevron Diagram Types
Chevron diagrams may be circular and linear. Linear Chevrons can be horizontal and vertical.
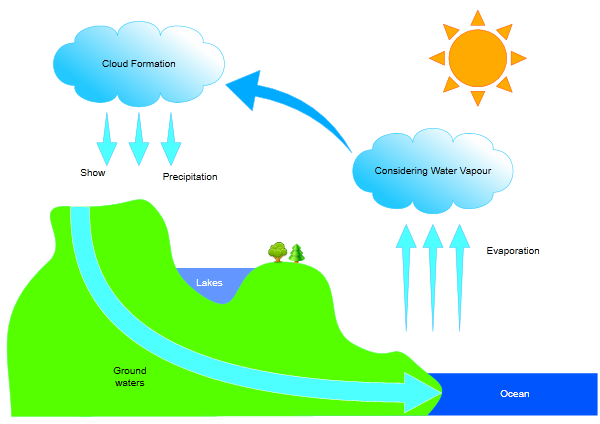
Circular Chevron diagrams are used to illustrate cyclic processes such as water circulation in the environment.
Horizontal Chevron diagrams are mainly used to depict the progress of sequential steps in the flow or process.
Vertical Chevron diagrams are usually used to represent a process as a list of steps with a main point and multiple sub-points.
Chevron diagram tips and tricks
First of all you need to define the type of process you want to illustrate.
Cycle processes represent some stages and actions which sequence makes a circle within some timeframe. End point of the cycle repeats start point but in other conditions or on other level. Most phenomena around us develop in cycles — occurrence > growth > prosperity > crisis > fading > occurrence of a new phenomenon.
Linear processes don't repeat within a given timeframe. In fact, it's very difficult to imagine a single independent linear process that can be illustrated with a single row chevron diagram.
There are always external factors, simultaneous processes that influence the process you want to illustrate. You just need to include then in the diagram to provide the complete idea.
How to draw Chevron diagrams
Now you know that the more information you have, the better you can present your ideas in the presentation.
You can use standard tools such as those included in Microsoft Word or PowerPoint. The main problem is that they are not designed for this purpose and are very inconvenient. Customizing the layouts each time is tedious and inefficient. You need to concentrate on drawing instead of thinking over the content.
There are a lot of specific diagramming solutions that allow quick drawing of impressive Chevron diagrams with just few mouse clicks. Grapholite is one of such solutions.
It offers pre-designed Chevron elements — circular and linear arrows of various shapes. Just double click one of them to add to the diagram area. Enter labels and here you go! Basic Chevron is ready!